Final week #blogjune 20

Last week at school. Racing to get my bi-annual report done before Friday, book my tickets for our 2 week train jaunt around China, pack our bags, prepare gifts, clean the house, finish updating the Library policy, clear my desk…

And I get this page:

Screen Shot 2016-06-20 at 12.02.51 pm.png

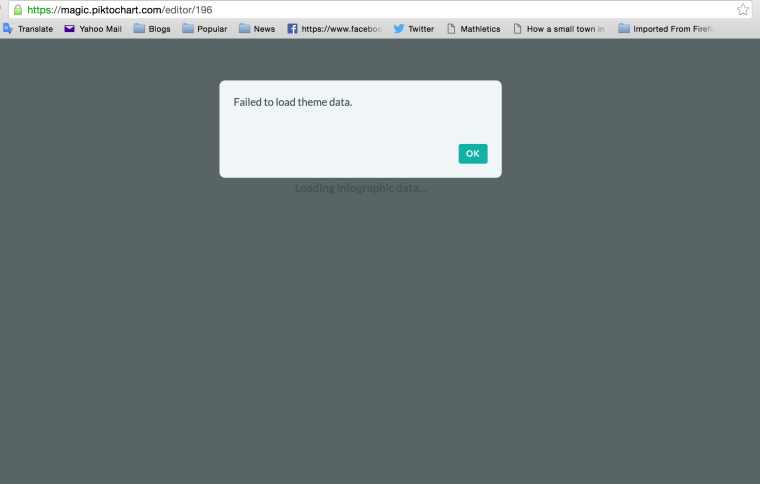
What do you think the Chinese Government have against infographics? Every single site seems to be blocked. I’m even trying with the VPN on (which we are not supposed to use at school) and it still won’t load. *cry cry cry*

At least I have an outline for my bi-annual report – I’m borrowing the headings from my Library Policy, which I think is a stroke of genius but is more likely biting off more than I can chew (a particular skill of mine):

Library Mission, Aims, Goals etc

  • community profile

Library Services

  • Teaching and learning (or curriculum)
    • Overview
    • Library orientation
    • Collaborative teaching
    • Development of resources
    • professional development/training
  • Reader Services
    • Book Week
    • Panda Book Awards
    • Displays
    • Book talks, discussions, book groups
    • Reading lists
    • Classroom support e.g. guided reading
  • Tech support
    • ICT lab
    • laptop / ipad loans
    • Library website
    • Recommended sites and tools
    • Training
  • Use of library space
    • Bookings

Collection development

  • Collection snapshot
    • new books
    • new collections (home language, graphic novel)
    • new digital resources

Circulation

  • circ stats e.g. top 10 primary, top 10 secondary
  • top borrowing homerooms

Staffing

  • Snapshot
  • Professional development and training attended

Evaluation and Goals – moving forward

  • Library services
  • Collection
  • Circulation
  • Staffing

Can I finish for this for Friday?? If not, I will blame the internet 🙂

Exit strategy #blogjune 16

Only 6 1/2 days of school to go. I’m tidying my desk, my Inbox, my Documents folder…and I’m sifting through the “Things I Started But Quickly Discovered Nobody Cared About So I Stopped” pile. It’s an unfortunate side effect of this role that I have developed a Very Bad Habit that goes completely against my character: I have stopped completing some tasks I know to be important when I’ve learned nobody cares about them, or worse, if I learn that other staff, or managers, mock me for doing them. It’s last minute, but I am so disappointed to make this realisation that I am going to try to rectify it to some extent by setting myself the challenge of creating an annual report for the Library using infographics.

I’m testing these sites:

Canva (can’t get the templates to load without VPN *cry cry cry*)

Piktochart (like a lot. Easy to use, pretty templates, loads without VPN)

Infogram (could be great, but templates won’t load without VPN)

Easelly (already annoying because weird layout and templates won’t load without VPN)

So I reckon I’m pretty much stuck with Piktochart, but that’s cool because it is cool! There’s some excellent advice about creating interesting annual reports here and here.

While I was playing about with them, it suddenly occurred to me that an infographic would make an awesome CV. It seems I am not the only person to have this thought! There are even companies who you can pay to create amazing graphic CVs for you, like Story Resumes, the people who created my favourite below:

lucyin